AURIN+ARUP hackathon: ChargeQuest (1st prize)
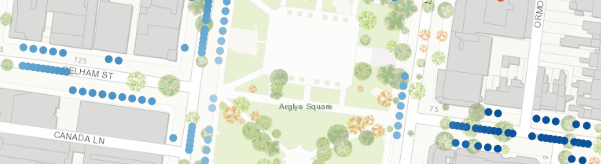
The study developed a roll-out strategy for the provision of on-street parking bays based on a hierarchy of parking bay suitability as a function of net solar potential and existing supply deficit.
The study developed a roll-out strategy for the provision of on-street parking bays based on a hierarchy of parking bay suitability as a function of net solar potential and existing supply deficit.
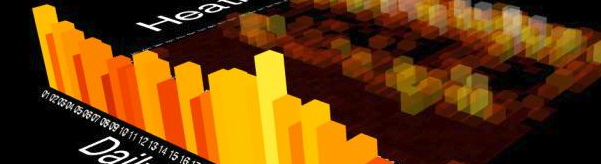
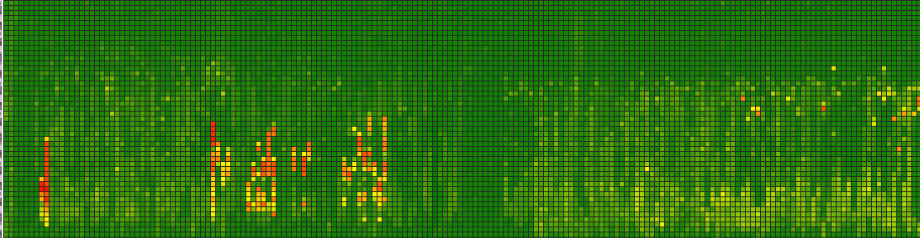
Part of an experiment in using three.js and color accessibility, this data visualisation offers an immersive 3D representation of smart meter over a month, allowing to feel the data in all its dimensions: hourly and daily variations, peaks and troughs of consumptions, anomalies and routines.
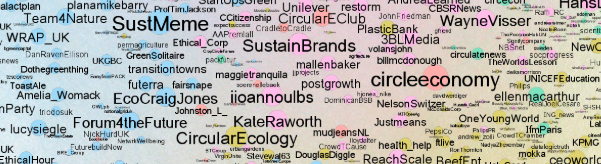
Exploring the users following a given Twitter user (CircularEconomy), this data visualisation groups similar followers into broad communities: corporate responsibility, international NGOs & think tanks, startup and thought leaders, environmental activists, …
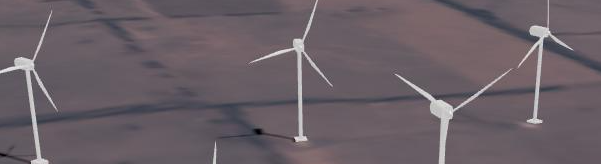
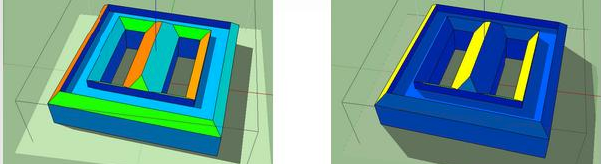
Part of an experiment in using three.js, this data visualisation recreates the layout of a Victorian wind farm, along with the terrain textured 4 ways (1 per season).
The Solar Atlas is a web tool to assess roof suitability for solar PV, at scale (locality / region) and at a high level of granularity allowed by LiDAR data(30cm).

A gamification of the bike share scheme using trip start / trip end data, calculating routing and displaying the movement of bikes as ghost in a Pacman-like Hoddle grid.
Part of a project for the Sustainable Energy Systems course at RMIT, this data visualisation quantifies the solar potential of an unusual roof configuration (a retirement home) by running irradiance simulation in the EnergyPlus engine, on a building envelope modelled in SketchUp.
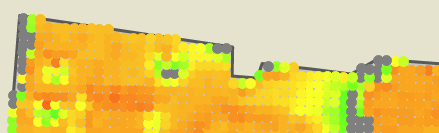
Developed while studying Sustainable Energy Systems at RMIT, and with the help of a social entrepreneurship grant from RMIT Social Entreprise group, this platform aims at visualising data that by-large remains invisible in our society: energy data. These visualisations are linking the personal - smart meter data - to the collective - national energy market and solar data. Smart meter data can be uploaded to the platform for an interactive heatmap visualisation, revealing patterns and anomalies. ...
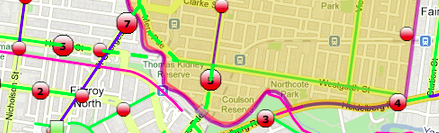
A web tool to bring together multiple datasets of interest to the cycling community, including bike routes and reported cycling accidents (VicRoads) along with the ability for cyclists to contribute their own “near misses” and safety hotspots.